Profiles
Campaign Participants
- Profiles have interacted with this campaign (including complete conversions).
- How is this calculated?
- This metric counts the distinct number of profiles that have had any interaction with a campaign
- No filters available
Active Participants
- Profiles that interacted with the campaign but not converted on the last stage.
- How is this calculated?
- This metric counts the distinct number of profiles that have had an interaction with a campaign minus profiles that are completely converted.
- No filters available
Completed Conversions
- Profiles that have converted on the last stage in the campaign.
- How is this calculated?
- This metric looks at the profiles interactions with the campaign and checks if there is a conversion on the last stage in the campaign.
- No filters available
Completion Rate
- Complete Conversions divided by Campaign Participants.
- No filters available
Participant Progress
- Progress of participants determined by the participant’s last interaction with the campaign.
- How is this “progress” determined in this chart?
- This chart looks at the last interaction the profile had with the campaign. That is then charted by the stage of that last interaction.
- No filters available
Events
Total Impressions
- Total Impression Events: How many times a prompt was activated and was shown to a user.
- How is this calculated?
- This metric is a count of how many impression events fired in a campaign.
- No filters available
Total Conversions
- Total Conversion Events: How many times did profiles convert on a prompt in the campaign.
- Important Note: Profiles can have multiple conversion events in 1 campaign.
- How is this calculated?
- This metric is a count of how many conversion events occurred in a campaign.
- No filters available
Conversion Rate
- Total Conversions divided by Unique Campaign Impressions.
- No filters available
Total Permanent Dismissals
- Total Permanent Dismissals Events: How many times did a profile check “Do not show again”
- Important Note: Profiles can have multiple permanent dismissal events in 1 campaign.
- How is this calculated?
- This metric is a count of how many permanent dismissal events occurred in a campaign.
- No filters available
Interaction by Touchpoint
- A breakdown of Unique Impressions or Conversions events per stage & touchpoint in a campaign
- How is this calculated?
- This chart filters to the specified interaction and counts the distinct number of profiles who have had that interaction per touchpoint.
- Important Note: For Unique Impressions, a single profile can have a unique impression for multiple touchpoints in a given stage.
- Filters: Interaction (Unique Impressions or Conversions)
Other
All these sections can be filtered by: Stage, Touchpoint, and Date Range
Campaign Breakdown
- A breakdown table of campaign events per:
- Stage
- Touchpoint
- Variant
- How is this calculated?
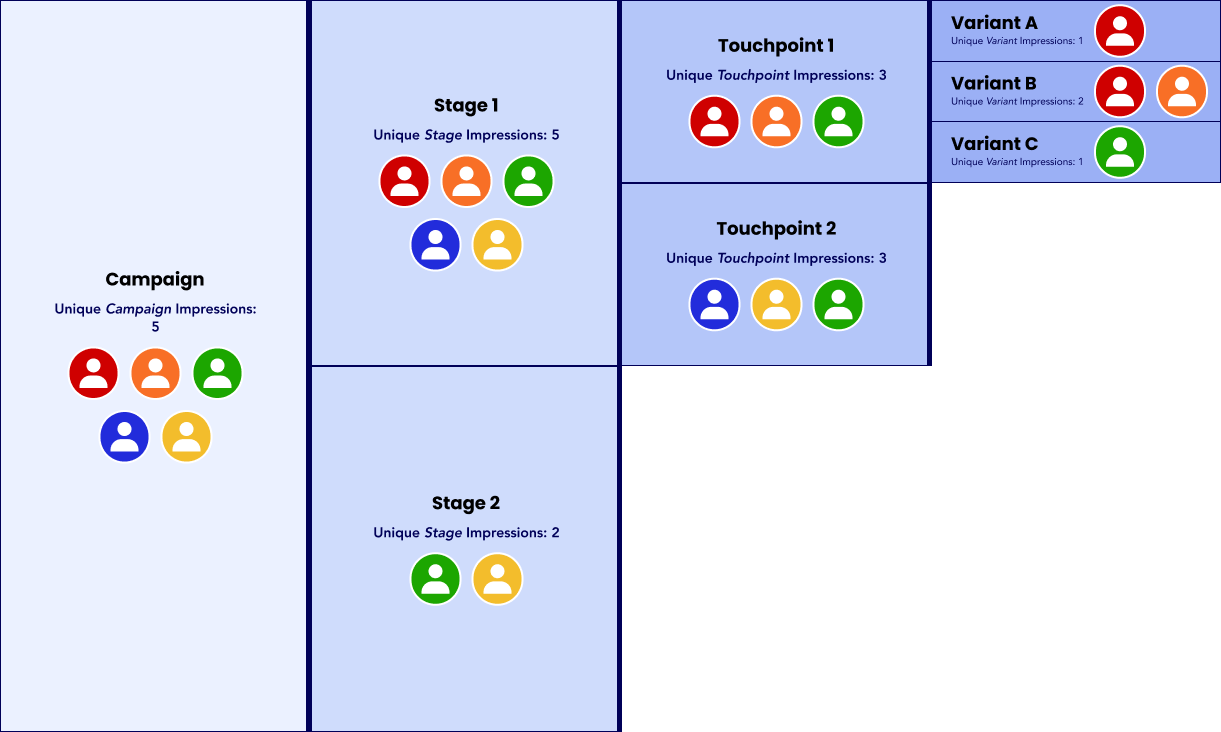
- Unique impressions are calculated per level by counting the distinct profiles with impressions. Below is a visual explaining how unique impressions are counted
Campaign Events Over time
- A line graph charting the campaign events over time.
- How is this calculated?
- The graph shows a count of total events – categorized by event type over time.
- Filters: Date Interval
Profiles with Conversion Events
- Profiles that have converted on ANY touchpoint in the campaign.
Top 10 Content Profiles – Highest Conversion Events
- A table showing content profiles with the most conversion events.
